")
")
In this article we summarize the most important test signals for audio measurements
Sine signals
A sine tone is the "purest" form of a sound and the most important test signal of all.
A sine signal is determined by the amplitude and the frequency
The peak value of a sinusoidal signal is 1.41 times greater than the effective value. A full-scale digital sine wave has a value range of –1.0 to +1.0 and an effective value of 0.7. This corresponds to -3dB.
If you put a sine wave at the input of a linear system, the output signal is also a sine wave. The amplitude and phase may have changed. The frequency always remains the same.
The following parameters, among others, are measured with sinusoidal signals
- frequency response
- phase response
- THD
- THD+Noise
- signal to signal-to-noise ratio
- transmission factors
- efficiency
- hearing tests
In room acoustics, sinusoidal signals are rarely used, since a normal room has considerable resonance. In the case of narrow-band excitation (and that is exactly what a sine tone is), these resonances can easily lead to misinterpretations.
For example, if you want to measure the distortion factor (THD) over the frequency, you increase the frequency step by step.
Note: Loudspeakers are designed for typical music and speech and not for such test signals and can be thermally and mechanically overloaded with single tones.
two-tone signals
Non-linear systems (eg loudspeakers) are often measured with a special test signal consisting of two tones with different frequencies. Difference tones are created by non-linear effects. We can easily demonstrate this effect. Tones with 18kHz and 19kHz are no longer perceptible for many people. However, if you play both tones at the same time, a clearly audible tone appears at 1kHz.
Intermodulation (IM) is measured with two-tone signals.
multi-tone signals
Multi-tone measurements are also widespread. Here the excitation signal contains several frequencies, for example in third-octave intervals. The frequency response can therefore be measured at several points simultaneously. Such signals are often used in production tests because many parameters can be measured with a short measurement time.
Sweep sine (wobble)
With a sweeping sine wave, the frequency is increased continuously and relatively slowly. It automatically measures the frequency response.
This classic wobbling is one of the oldest methods to determine the frequency response. A measurement of the frequency response is relatively slow, since the system must first settle. The enormous advantage, however, is that it is very insensitive to noise or distortion. This is because the signal energy is concentrated at one frequency. Therefore, this method is still very widespread. In the days of analog plotters, swept sine signals were used. Here the frequency was increased continuously. The plotter records the amplitude of the output signal. This gives you the direct frequency response. The frequency can be increased linearly or logarithmically. Modern automated systems measure step by step in a specified frequency range.
Chirps
Chirps are relatively modern signals. They are a special form of the sliding sine. Amplitude and frequency are increased here using a special process. Chirps have special properties that are best seen in autocorrelation. In chirp signal is orthogonal to each shifted variant.
Chirp sequences always have a length that is a power of two.
Chirps are often used in room and building acoustics to measure the room impulse response. Relatively long sequences of up to 60s are used here. Purely electrical measurements (frequency response) are carried out with shorter sequences. This method can be used to suppress interference signals very efficiently.
White noise
The term noise is ambiguous. On the one hand, the noise in recordings should be as low as possible. On the other hand, along with the sine signals, noise is the most important test signal in electroacoustics. An ideal noise signal can be interpreted as a multi-tone signal with an infinite number of frequencies and each with a random phase.
A well-known source of noise is thermal noise, which is caused by the random movement of electrons. If you determine the probability density function (histogram), you get the famous Gaussian curve. If you look at such a signal in the frequency domain with a spectrum analyzer, the spectrum is constant. Strictly speaking, this is the spectral power density, i.e. the signal component per heart. The name "white" comes from the analogy with light. Electromagnetic radiation, which is constant in the range between 400nm and 630nm, is perceived by our eyes as white light.
Note: White noise contains a lot of energy at high frequencies and is therefore potentially dangerous for loudspeakers (particularly the tweeter). Loudspeakers are designed for typical music and speech and not for such test signals and can be thermally overloaded with white noise.
Spectral analysis of white noise
The following picture shows the spectrum of white noise. The blue curve is the instantaneous value. The red curve is the average over 20s. White noise has a constant mean spectral power density.
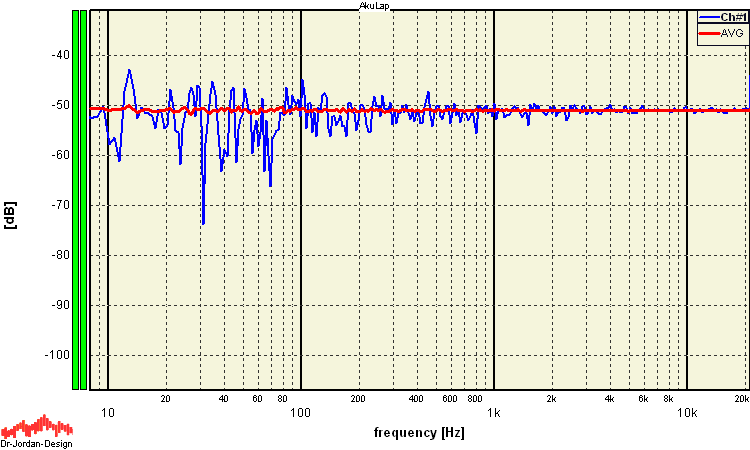
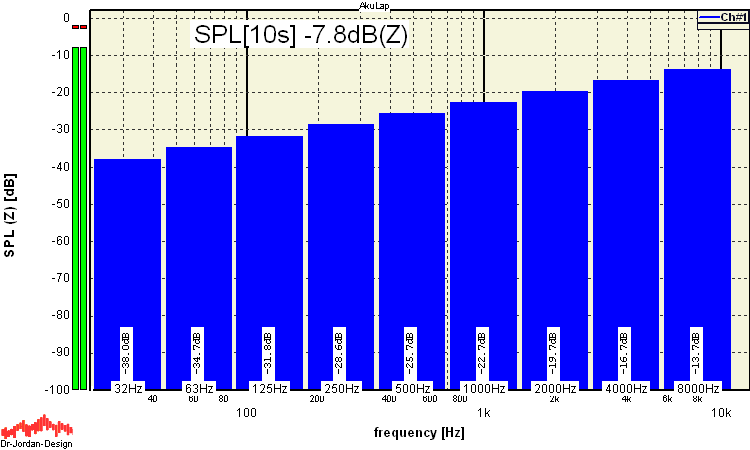
The energy distribution is best seen in octave bands. The level increases by 3dB per octave (double frequency).
Pink noise
The human ear does not perceive frequencies linearly but logarithmically. Therefore, the audible range is divided into bands. The width of these bands increases with increasing frequency. In psycho-acoustics, the Bark scale is also used for this. For simplification, a simple logarithmic classification is generally used, the frequencies of which are normalized according to DIN/ISO. A measuring device that measures the signal content in these bands is often referred to as an RTA (Real-Time Analyzer). Octave or 1/3 octave resolutions are common.
If you look at white noise with an RTA, the level increases with increasing frequency. The bands at high frequencies are wider and then receive more signal components. The 10-20kHz band already contains 50% of the total signal. In the band between 1-2kHz only 1/10. The curve rises at 3dB per octave. There is therefore hardly any component in the lower frequency range. Therefore, white noise is unsuitable for measurements in the bass range. One gets the apparent paradox that the uniformly distributed white noise emphasizes the highs. Therefore, pink noise is preferred in many measurements. On an RTA you get a flat gradient. Therefore the spectral power density must decrease with 3dB/octave.
Pink noise contains much lower signal components in the treble range and is therefore not dangerous for the mostly sensitive tweeters.
On average, pink noise also corresponds more closely to music or speech than white noise. Pink noise measurements should typically be made with an RTA. Correspondingly, a normal spectral analysis is used for white noise.
Note: Pink noise may contain high levels at low frequencies and is therefore potentially dangerous for speakers (especially the woofer). Loudspeakers are designed for typical music and speech and not for such test signals. Pink noise can cause the diaphragm to exceed its maximum deflection.
Spectral analysis of pink noise
The following picture shows the spectrum of pink noise. The blue curve is the instantaneous value. The red curve is the average over 20s. Pink noise decays with 3dB per octave.
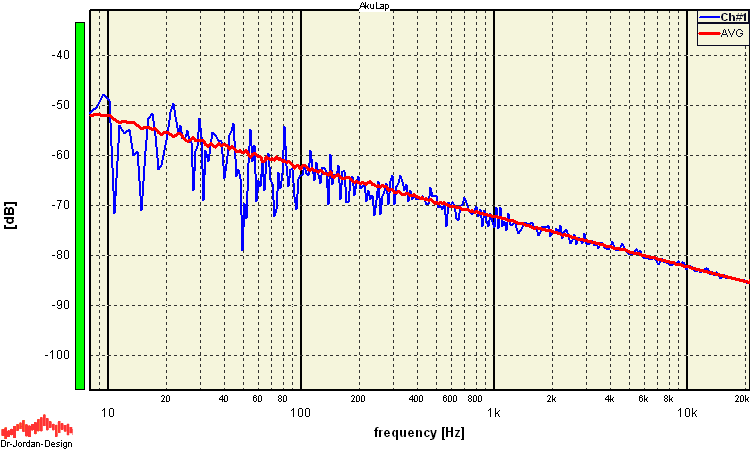
By using an octave band analyzer, we get a contant level. Please note, that we get a stronger fluctuation at lower frequencies.
Application of noise signals
Noise signals are broadband. After sufficient averaging, the frequency response can be determined in one pass. Pink noise is an important test signal in room and building acoustics. In room acoustics, the reverberation time can be determined using the switched-off noise method. In building acoustics, this is used to measure the airborne sound transmission factor between two rooms.
Band-limited or narrow-band noise is also often used.
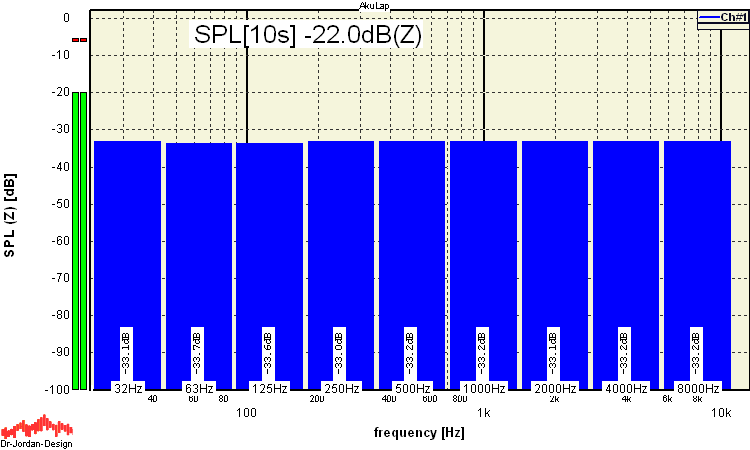
STIPA noise
The STIPA test signal is used to measure speech intelligibility according to DIN60268-16. It consists of 8 octave bands of band-limited pink noise. Each octave band is amplitude modulated with two relatively low frequencies. The frequency bands are 125, 250, 500, 1000, 2000, 4000, 8000 Hz.
The signal has been designed in such a way, that it matches human speechif you observe spectral averages.
Program noise ( IEC60268-1 ) "Program noise"
White and pink noise are only suitable to a limited extent for tests on loudspeakers. The spectral distribution deviates too much from the typical use of a loudspeaker. These are ultimately designed for speech and music. Especially for the measurement of the continuous load capacity or the maximum level you need a signal that spectrally corresponds to the typical use. Therefore, the "program noise" was developed and defined in IEC60268-1. It is ultimately based on a special frequency weighting of pink noise. In addition, the crest factor is adjusted in the BS EN 50332 standard (1.8 to 2.2) in order to remove peak levels that are atypical for music or speech.
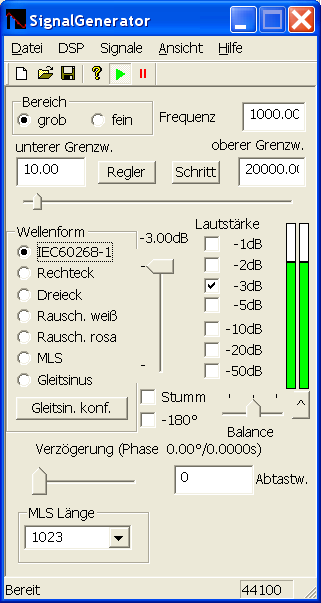
How can you generate these test signals?
You can generate all these signals with our signal generator, listen to them directly and save them as a .wav file if required.