")
")
Plug-in for Audio Precision APX Sequence Mode to measure psycho-acoustics parameters (time-variant Loudness in sone DIN45631/A1, ISO532-1, Sharpness, Roughness, Impulsiveness)
![]()
Complete psycho-acoustic measurement suite for the APX frameworkAudio Precision offers a powerful framework - the APX software - for automatic audio measurements. This software supports the following devices: APX555, APX515, APX525, APX585 and the new APX flex for ASIO compatible sound cards.In addition to many built-in measurement functions, the plug-in interface in the 'Sequence Mode' of the APX software enables the modular loading of extended functions. Akulap is powerful audio analysis software that covers a wide range of audio measurement technology. The field of psycho-acoustic measurement technology (Zwicker et. al. invented the basics decades ago) has gained in importance in recent years.
Therefore we offer a powerful psycho-acoustic model as a plugin for the APX family, which calculates a wide range of psycho-acoustic parameters. These plug-ins fit seamlessly into the Sequence Mode, so that you can use all measurement functions and analysis of the APX software. The loudness calculation is done in the background with Akulap.
This package calculates the following parameters:
- Loudness in Sone DIN 45631/A1 ISO 532-1, multi-channel
- Specific Loudness
- Loudness time-invariant ISO 532B (classical Zwicker Model), multi-channel
- SPL A-weighting Fast
- Sharpness DIN 45692
- Tonal components DIN 45681
- Roughness (Daniel & Weber)
- Impulsiveness
- Percentile
- Spectrogram (with external picture view), multi-channel
- Analysis of .wav files
Details
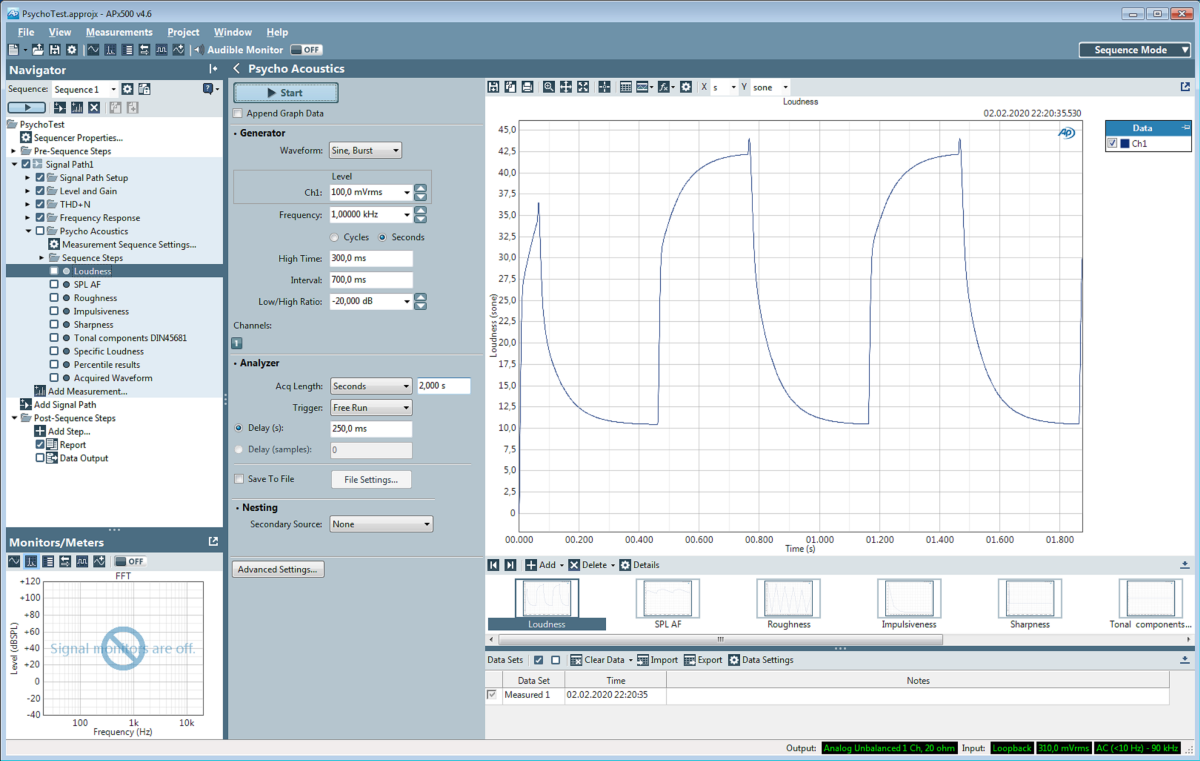
This module integrates itself into the measurement functions of the sequence mode. You can use all functions of the APX software. These are in particular the generator, filter, calibration, evaluations and creation of reports.The plug-in Psycho-Acoustics first configures and starts the generator and stores the audio data for an adjustable time interval (1s to 45s). The selected analysis functions are then started. All analysis functions evaluate the same audio data.
Background
Sound can be described using various physical parameters such as sound pressure, sound intensity or sound energy.However, these values can not sufficiently reflect the subjectively perceived volume. The different weighting curves (A or C) represent a first approximation. They take into account the different sensitivity of the human ear as a function of frequency. However, these sensitivities depend on the level. This results in a variety of different weighting curves. The most common are the A and C curves. A low volume pure sine tone of e.g. 50dB (A) is perceived as the same at different frequencies. These results go back to Barkhausen's research, which he published around 1920. However, pure sine tones are rather rare in nature, so that the sense of hearing is only reproduced inaccurately. The widespread use of these measured values lies solely in the fact that they can be determined comparatively easily from the physical quantities. Therefore, these ratings are now included in almost all handheld sound level meters.
Sound Level dB(A)
Sound is usually first converted into an electrical signal using a microphone. The RMS value of this signal is a measure of the sound level. This quantity correctly describes the physical level. However, it is not suitable for meaningfully describing the perception of the level. For this purpose, the signal is filtered in time and in the frequency domain in order to achieve a rough approximation of the perception. The most important evaluation curve is the A curve. High and low frequencies are significantly reduced in the calculation. The ear, however, has different evaluation curves depending on the level. The C curve is still common. Since a display in a sound level meter cannot follow a level that fluctuates over time, the signal is weighted (filtered) in the time domain. This corresponds to a damping of a pointer instrument. The usual time constants are impulse (I 35ms), fast (F 125ms) and slow (S 1s). In addition, the sound level is logarithmized according to the ears' perception (display in dB). You will find these functions in almost every sound level meter, as they can be easily implemented technically. This ensures high comparability of the measured values. However, a sound level in dB (A) describes the sensory perception only inadequately. An identical sound level can be perceived significantly differently. Therefore, psychoacoustic measures such as loudness in sone are increasingly used. There is a much better comparability here.
Loudness (sone)
A broadband noise produces a subjectively perceived volume than a single tone of the same level measured in dB (A). This simple measure is therefore only of limited significance. Zwicker has intensively examined such psycho-acoustic effects and created models for hearing perception. A simple effect is e.g. the masking effect. If a signal consists of a loud tone, quieter tones are not heard. At a symphonic concert, no one would recognize the soft tripping of a mouse, although it would be audible in soft musical phases. These and other effects also serve as the basis for lossy audio compression such as the well-known MP3 method for compressing music. Signal components that cannot be heard according to the models are not stored in the data stream.Based on its extensive hearing tests, Zwicker has developed a loudness measure, which is a much better measure than dB (A) for stationary signals. The unit of loudness is sone. In contrast to dB (A), this is a linear quantity. This means that e.g. 2 Sone is twice as loud as 1 Sone. The reference point is 1 sone, this corresponds to a pure sine tone with 1000Hz at a level of 40dB.The applications are e.g. in the assessment of air conditioning systems, ventilation systems, but also typical PC components such as hard drives or CPU coolers etc. The loudness takes into account the subjectively perceived volume. However, it does not describe how pleasant or disturbing a sound is. Many people perceive a sinus tone as more pleasant than the sound of a dentist's drill with the same loudness.The loudness calculation is based on the results of a third octave analysis. Loudness measurement also requires calibration to absolute sound levels. A handheld sound level meter or a calibrator is required for this. Essentially two procedures have been established for stationary signals: DIN 45631 or ISO 532B. This method has been available for many decades and is particularly suitable for ventilation systems where the signal is constant, i.e. time-invariant. This simple model does not take into account the temporal masking effects of the human ear.For time-variant signals: DIN 45631 with Appendix A1 or ISO 532-1. This model is significantly more complex and describes hearing even with signals that change over time and is therefore much more general. This method is often used in NVH (Noise Vibration Harshness).
Specific loudness
The specific loudness is the loudness per frequency band. If we show the specific loudness against the frequency, this corresponds to a spectrum. However, if we do not use a linear frequency axis in Hz, but use a Bark scale that is better adapted to hearing.If we integrate the specific loudness over the Bark scale, we get the loudness as a single value.
Percentiles
Acoustic parameters are subject to strong fluctuations over time. The classic parameter sound level is often averaged in an energy-equivalent manner (LEQ). However, percentiles are predominantly used for psycho-acoustic parameters. The 5, 50 and 95% percentiles are common. A 95% percentile value of e.g. 73 Sone indicates that 95% of all measured values in the time interval are above 73 Sone.
Sharpness DIN 45692
The sharpness is one of the essential hearing sensations according to Zwicker. A tone is perceived as “sharper”, frequency components are higher in the upper frequency range. The sharpness is measured in the unit "Acum". The reference signal with 1 acum consists of a narrow-band noise (920 Hz to 1 080 Hz) at a level of 60dB. The sharpness is calculated from the specific loudness using a standardized weighting method.
Tonality DIN 45681
If an acoustic event contains perceptible tonal components, this is particularly taken into account by human perception. In general, the "annoyance" increases. A "tonal penalty" in the range of 0 to 6 dB is therefore calculated according to DIN 45681. The analysis is based on a narrowband analysis and takes into account masking effects in the frequency domain.
Impulsiveness
If an acoustic event contains perceptible impulse-like components, this is particularly taken into account by human perception. In general, the "annoyance" increases. The calculation is based on an evaluation of the loudness curve over time.
Roughness
Roughness is also one of the core perceptions according to Zwicker. This impression can be clearly explained with two tones. If both tones have the same frequency, this pure single tone has no roughness. If you increase the frequency of one tone, a beat effect arises, which is perceived similarly to an amplitude modulation. The volume fluctuates with the difference frequency. The roughness effect occurs from a modulation frequency of 20 Hz. The roughness is measured in Asper. A signal with a frequency of 1 kHz and an amplitude modulation of 70 Hz (degree of modulation 100%) has a roughness of 1 Asper at a level of 60 dB. The parameter roughness is not defined by international standards. However, the Daniel & Weber algorithm has been established for several years.
